
How to Measure Dissolved Ozone in Water: Methods, Sampling and Control
Compare indigo, membrane, UV, DPD, iodometric and ORP methods; then design sampling, verification and control for dissolved ozone in water.
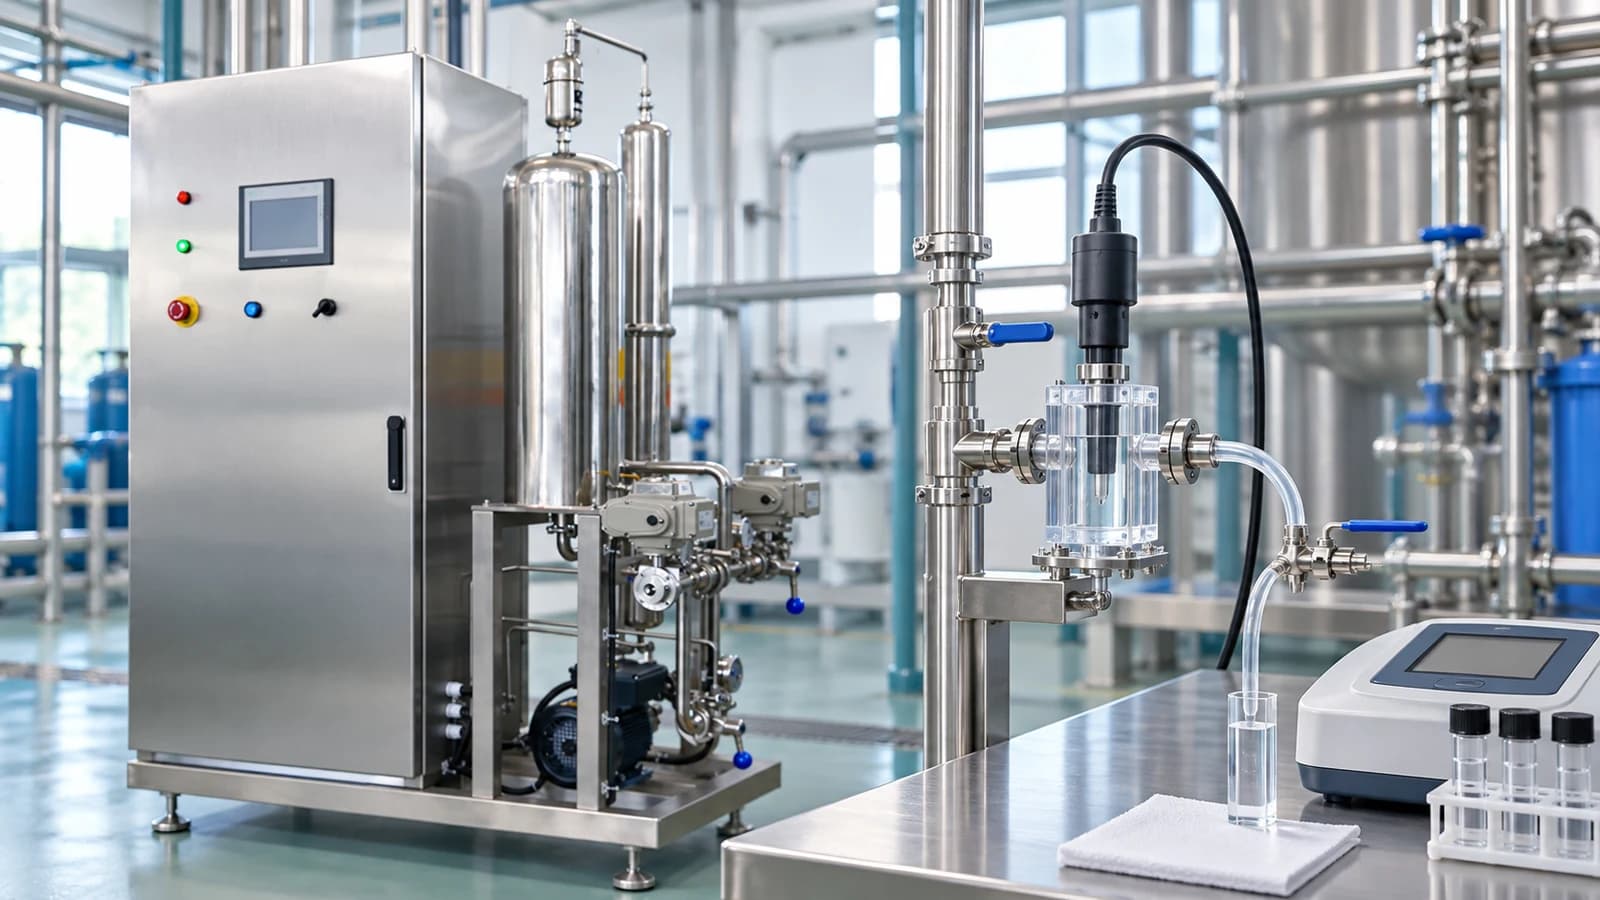
Short answer: there is no universal method for measuring dissolved ozone in water. First define what must be measured—molecular ozone, total residual oxidants, a redox trend or the treatment outcome—and at which process point. Then choose a method for the water matrix, expected range, grab or continuous duty, response time and interferences. Treat the sample point, tubing and flow cell as part of the instrument; verify online readings with an independent immediate reference method; and do not convert ORP directly into mg/L ozone without site-specific evidence.
This guide is for water-treatment owners, process and instrument engineers, EPC teams, laboratories, operators and procurement teams who must specify, commission or accept an ozone measurement. It explains what indigo colorimetry, membrane sensors, UV methods, DPD or iodometric methods and ORP can—and cannot—show. It does not replace the controlled analytical method, current instrument manual, laboratory procedure or project-specific acceptance authority.
The practical rule is simple: define the quantity, location, method and decision before selecting the analyzer. A display that reads “ozone” is not enough. The project must know whether the result is used to prove generator output, transfer into water, a dissolved residual, a saline-water oxidant boundary, process control or the final treatment objective.
What exactly are you trying to measure?
Many ozone measurement disputes begin because two parties use the same word for different quantities. A gas analyzer can verify product-gas concentration, but it does not measure dissolved ozone. A water analyzer can report ozone at one sample point, but it does not by itself prove how much gas transferred across the whole contactor. ORP can show that the redox condition changed, but it does not identify the oxidant or express molecular ozone concentration.
Separate these six quantities in the process and instrumentation documents:
- Generated ozone: ozone mass produced per unit time, calculated from compatible gas concentration and gas-flow bases.
- Applied ozone: ozone mass sent to the injection or diffusion boundary after any controlled split, recycle or loss.
- Transferred ozone: the part of applied ozone that moves from gas into the water across the real contact system.
- Dissolved molecular ozone: ozone present in the liquid at a named point and time, before it reacts or decomposes.
- Total residual oxidants: an analytical response that may include longer-lived ozone-produced oxidants, particularly in saline or bromide-containing water.
- ORP: a non-specific electrochemical indication of the sampled water’s combined oxidation-reduction condition.
The ozone concentration versus output guide owns the gas-side units and calculation boundary. The mass-transfer, contact and off-gas guide explains the gas-to-liquid mass balance. This article begins at the water sample point and follows the evidence through control and acceptance.
Define the measurand first
Six quantities that must not be treated as one number
Only the declared location, method, unit and decision make an ozone reading meaningful.
Generated
Gas concentration × compatible gas flow gives ozone mass rate.
Applied
Mass sent to the declared injector or diffuser boundary.
Transferred
The fraction crossing from gas into the real water stream.
Dissolved O₃
Molecular ozone at one named sample point and time.
TRO
Method-defined residual oxidants, important in saline water.
ORP
A combined redox signal—not an ozone concentration.
Decision rule: do not use one measurement to claim a different boundary without an evidenced mass balance or method relationship.
Write a measurement statement before buying an instrument
A useful statement has the form: “Measure [named quantity] in [named matrix] at [physical location], under [operating cases], using [method family and unit], with [response time and range], to make [control or acceptance decision].” If any bracket is blank, supplier comparisons will mix incompatible instruments and responsibilities.
For example, “continuous dissolved molecular ozone at the contactor outlet for feedback control” is a different task from “immediate grab-sample confirmation of no measurable ozone before a sensitive downstream process.” A saline aquaculture return may instead require total residual oxidants on a declared reporting basis. A drinking-water process may need both a contactor residual and independent verification of the finished-water objective. The same display value cannot be assumed to serve every task.
How should dissolved-ozone methods be selected?
Method selection should start with the water, not a preferred brand. Record temperature, pH, conductivity, salinity, bromide or other halides, suspended solids, colour, UV-absorbing compounds, disinfectants, reducing agents and expected process variation. Then define minimum, normal, maximum and alarm concentrations, as well as whether a short-lived peak or an averaged trend controls the decision.
Ask seven questions:
- What is the measurand? Molecular ozone, total oxidants, redox trend or a separate treatment endpoint?
- Is the duty grab or continuous? A laboratory/reference method and a feedback signal solve different problems.
- What matrix reaches the sensor? Clean low-conductivity water, municipal water, industrial wastewater and seawater create different interferences and maintenance burdens.
- How fast must the result arrive? Ozone can decay during transport, while control loops need a response time shorter than the process change they are meant to manage.
- What range and resolution are actually required? A method optimized for higher residual may be unsuitable near a critical low-level boundary, and vice versa.
- What can interfere? Other oxidants, colour, particles, optical absorbers, flow, pressure, bubbles and electrode condition may change the response.
- How will the result be verified? Every critical online signal needs a defined reference, frequency, tolerance, owner and action when the two disagree.
The current ASTM D7677 scope illustrates why limits matter: it addresses continuous membrane-covered electrochemical measurement in low-conductivity water within its stated conditions. That is valuable evidence for the named application, not permission to apply the same performance to every wastewater or saline sample.
When is the indigo method useful?
Indigo colorimetry is widely used as a grab or reference method for aqueous ozone. Ozone decolorizes an indigo reagent, and the change in absorbance is related to ozone concentration through the controlled method. The strength of this route is that the reaction can capture the short-lived analyte immediately when the sample and reagent are combined correctly.
The NEMI summary of Standard Methods 4500-O3 B describes the indigo method as quantitative, selective and simple while also identifying oxidant interferences. Hach Method 8311 reinforces the operational point: analyze immediately, do not preserve the sample, and avoid handling that lets ozone escape or decay.
Control the sample before interpreting the colour
Prepare the reagent, blank, cell, wavelength, calibration basis and dilution plan under a controlled procedure. Bring reagent to the sample point when practical. Fill gently without splashing or headspace, react immediately, and record sample time, reaction time, water temperature and location. Extra transfers, shaking, warming, bubbles and delay can lower the apparent result before the instrument ever reads the cuvette.
Reagent quality also matters. Peer-reviewed work on the indigo sensitivity coefficient shows that reagent purity and stability can influence the result. That does not invalidate the method; it means the laboratory must control reagents, blanks, checks and calculations rather than treating every blue solution as an automatic reference.
Indigo is not interference-free. Bromine-related oxidants and some other oxidants can respond under certain conditions. Highly coloured or turbid samples may need a sample blank or another method. The laboratory should document exactly what the procedure reports in the actual matrix and whether the result is molecular ozone or a broader response.
When is a membrane dissolved-ozone sensor useful?
Membrane-covered amperometric or polarographic sensors can provide a continuous signal for trend, control, alarm or data logging. Ozone diffuses through a selective membrane and participates in an electrochemical reaction that produces a signal related to concentration. This makes the sensor attractive where operators need more than intermittent grab samples.
Continuous does not mean context-free. The sensor, membrane, electrolyte, flow chamber, cable, transmitter and installation form one measurement system. Sample flow and pressure must remain within the selected instrument’s requirements. A bubble against the membrane changes the contact condition; loss of flow may create a stale sample; pressure changes can alter membrane behavior; deposits can slow response; and an exhausted electrolyte or damaged membrane can create drift or failure.
The flow cell must therefore be shown on the drawings with isolation, flushing, drain or return, safe access and a sample point for comparison. The sample line should be short, chemically compatible and arranged to minimize gas release and delay. If the sensor is installed directly in process, the mounting, velocity, service access and exposure to solids still require review.
Online sensors still need an independent check
Calibration or verification should use the current manufacturer procedure and an independent reference method suitable for the water. Record the online reading and grab result at synchronized times after the loop is stable. A mismatch is not solved by automatically forcing one number to the other: first investigate sample-point equivalence, transport lag, temperature, flow, bubbles, membrane condition, reagent quality, interference and timestamp alignment.
Model-specific manuals describe conditioning time, zero or span procedures, membrane changes and maintenance intervals. Those instructions should remain model-specific. A clean pharmaceutical-water schedule should not be copied into industrial wastewater, and a vendor range should not be presented as a universal design range.
What about UV, DPD, iodometry and ORP?
These methods can all be useful, but they do not answer the same question.
UV absorption
Ozone absorbs ultraviolet light, so an optical instrument can estimate concentration from absorbance when path length, wavelength, calibration and interfering absorption are controlled. Some systems measure directly through water. Others strip ozone from a known water stream into gas and measure the gas by UV, using the instrument’s validated transfer and calculation model.
Direct UV works best when the optical matrix is understood. Turbidity, fouling, dissolved compounds, by-products and baseline drift can affect the signal. A transfer-column arrangement adds water and gas flows, stripping efficiency, temperature and equilibrium assumptions. Both routes can support continuous monitoring, but neither should be described simply as “interference free.”
DPD and iodometric methods
DPD colorimetry and iodometric titration can measure oxidizing capacity under defined procedures. They may be useful at different ranges or in particular application standards. However, other oxidants can contribute to the response. The current DIN 38408-3 summary explicitly lists several ozone methods and notes that analysis should be immediate because ozone decays.
State the reagent, instrument or titration procedure, interferences, blank or masking steps, unit and reporting basis. In saline water, a DPD or iodometric result may represent total residual oxidants rather than only molecular ozone. A value reported “as ozone” or “as chlorine equivalent” must not be silently compared with a direct dissolved-ozone sensor.
ORP
ORP is useful for observing a combined redox change, detecting abnormal conditions and supporting a secondary permissive or interlock. It is also relatively simple to trend continuously. But ORP responds to the entire electrochemical system: oxidants, reductants, pH, temperature, dissolved oxygen, electrode surface, fouling, flow and sample location all matter.
There is no universal equation that turns millivolts into mg/L dissolved ozone. A site may establish an empirical relationship across a defined water and operating envelope, but that relationship can move when the matrix, probe or process changes. Use ORP as ORP; verify ozone or TRO with a direct, suitable method.
Conditional method selection
Choose by output, duty and water—not by instrument label
Each method is useful inside a defined analytical and process boundary.
Indigo colorimetry
Output: Immediate grab/reference dissolved-ozone result
Best fit: Independent checks and point measurements
Watch: Delay, handling, reagent, blank and oxidant interference
Membrane electrochemical
Output: Continuous dissolved-ozone signal
Best fit: Trend, alarm and feedback in a suitable matrix
Watch: Flow, pressure, bubbles, membrane, electrolyte and fouling
UV absorption
Output: Continuous optical ozone estimate
Best fit: Known optical matrix or validated transfer-column system
Watch: Turbidity, absorbers, baseline, fouling and implementation model
DPD / iodometry
Output: Method-defined oxidizing capacity
Best fit: Declared standard/application and range
Watch: Other oxidants, masking, unit and reporting basis
ORP
Output: Composite redox potential
Best fit: Trend, plausibility and secondary interlock
Watch: Not molecular ozone; matrix, pH, electrode and location effects
Comparison rule: specify a reference method even when the project needs a continuous analyzer.
How does saline water change ozone residual measurement?
In brackish water and seawater, ozone can react with bromide and other halides to form longer-lived oxidants. Molecular ozone may disappear while residual oxidizing capacity remains. This is why a dissolved-ozone sensor, an ORP probe and a total-residual-oxidant method can show different trends without any instrument necessarily being wrong.
Before selecting the measurement, define the safety or process question. If the question is molecular ozone at a contactor outlet, use a validated ozone-specific route. If the question is oxidant exposure before water returns to aquatic life, a matrix-appropriate TRO method may be more relevant. If ORP is used for rapid trend or trip logic, verify its relationship to the direct residual method over the operating envelope.
The RAS ozone engineering guide explains the side-stream, residual-management and biological return boundary. Do not transfer one species study, salinity, ORP value or TRO threshold into another project. Record the reporting unit, sample delay, temperature, salinity and laboratory method with every result.
Where should the water sample be taken?
A dissolved-ozone result belongs to one physical point. Measurements at the injector discharge, contactor outlet, post-destruction boundary and final process return can all be correct yet different because reaction, decay, mixing and degassing continue between them. Mark every point on the process diagram and assign its purpose.
- Transfer or contact point: helps characterize the immediate liquid response but may be sensitive to incomplete mixing and bubbles.
- Contactor outlet: can support process control when the sample represents the hydraulic outlet and transport lag is known.
- Post-residual-treatment point: verifies a downstream boundary before sensitive equipment, biology or discharge.
- Final acceptance point: proves the named project criterion at the contractual location, not at a more convenient upstream tap.
- Laboratory/reference tap: should sample the same water and time basis as the online instrument comparison.
Engineer the sample line as part of the analyzer
Minimize length and stagnant volume. Use compatible wetted materials, a representative take-off, a stable flow and pressure arrangement, and a discharge route that does not create unsafe ozone release. Avoid high points that trap gas, throttling that causes degassing, heat sources, excessive pump shear and transparent tubing exposed to strong light where they affect the method or service life.
Calculate or measure sample transport time at minimum and normal flow. Add the analyzer response and signal filtering to obtain the effective control delay. A fast sensor on a long slow sample line is still a slow measurement. Label the historian tag with the sample location, not merely the cabinet location.
Take grab samples without changing the analyte
Flush the point under the controlled procedure, then collect and react with minimal turbulence, headspace and delay. Do not store the sample for a later shift unless a validated method specifically allows it; ozone generally cannot be preserved like a stable ion. If a laboratory is remote from the process, bring the reaction step to the process or use a justified alternative rather than transporting untreated sample and assuming no change.
How should online ozone measurements be verified and maintained?
A good QA plan separates instrument health from process truth. An analyzer can be healthy while the sample line is blocked, or unhealthy while the process remains normal. A laboratory result can also be wrong because the sample decayed or an interference was ignored. Use multiple checks with defined owners.
- Installation qualification: verify tag, range, unit, location, wetted materials, flow/pressure, wiring, scaling, timestamp and safe discharge.
- Zero and functional checks: confirm the approved zero or ozone-free condition and that the signal responds in the expected direction.
- Reference comparison: compare with an independent immediate method at synchronized stable conditions across relevant low, normal and high cases.
- Trend review: relate residual to applied ozone, water flow, temperature, pH, demand indicators and treatment outcome rather than viewing one tag alone.
- Drift and fouling review: inspect response time, baseline, membrane or optical surfaces, flow cell, tubing, reagent and sample flow.
- Out-of-tolerance action: define when to clean, recalibrate, replace consumables, place the loop in manual, reduce or stop ozone, or rely on an approved alternate measurement.
- Record control: retain instrument configuration, maintenance, reference results, deviations, corrective actions and return-to-service approval.
Do not choose verification frequency by copying an arbitrary calendar interval. Base it on measurement criticality, instrument stability, matrix fouling, change history, manufacturer instructions and project requirements. A safety-critical low-residual boundary may need different assurance than a non-critical process trend.
Measurement is a chain
From process water to a defensible control decision
A sensor specification is incomplete until every upstream and downstream link has an owner.
Process point
Name the physical location and the decision it supports.
Sample transport
Control materials, flow, pressure, bubbles, lag and discharge.
Analyzer
Apply the declared method, range, unit and health status.
Reference QA
Compare synchronized immediate results and investigate drift.
Control action
Define modulation, alarm, trip, diversion and bad-signal state.
Acceptance
Prove the residual boundary and treatment outcome separately.
Instrument proof: the loop is healthy.
Residual proof: the named boundary is met.
Process proof: the treatment objective is achieved.
How should the signal be used for ozone control?
A dissolved residual can support feedback control, but it should not act alone without process permissives and signal validation. Begin with water flow and an established demand basis. Confirm that ozone generation, gas flow, contact hydraulics, off-gas treatment and downstream residual management are available. Then use the residual signal within its validated range and delay.
Good control logic distinguishes:
- normal modulation: adjust within approved limits while the signal and process are plausible;
- high or high-high residual: reduce output, stop ozone, isolate gas or divert water according to the hazard analysis;
- low residual: investigate demand, generation, transfer, mixing, instrument and sample flow before simply increasing output;
- bad or frozen signal: move to a defined safe state rather than controlling from stale data;
- reference disagreement: suspend automatic acceptance, investigate both methods and document the decision;
- loss of water flow or contact: stop ozone independently of the residual reading.
A residual reading proves neither the treatment objective nor regulatory compliance by itself. Pair it with the named outcome: disinfectant exposure under a validated method, colour or organic response, micropollutant evidence, oxidation target, or a protected return condition. The municipal drinking-water, industrial wastewater and aquaculture pages show why application acceptance belongs to the complete process.
What should FAT, commissioning and acceptance verify?
Factory acceptance can verify panel scaling, simulated input behavior, alarms, communications and documented analyzer configuration. It usually cannot reproduce the site water, sample line, pressure, temperature, matrix interference or reaction demand. Site commissioning must close those gaps.
- Confirm the documents: tag list, datasheet, method, range, unit, sample-point drawing, loop diagram, cause-and-effect, maintenance owner and acceptance basis.
- Inspect the installation: representative take-off, short compatible tubing, stable flow and pressure, bubble control, drain/return, isolation, access and safe sample handling.
- Verify data integrity: transmitter scaling, PLC/DCS value, historian tag, timestamp, bad-signal status and displayed precision.
- Run ozone-free checks: establish the approved baseline and identify response from other oxidants or matrix effects.
- Introduce ozone under an approved ramp: compare online and immediate reference results at synchronized conditions and record transport/response delay.
- Test operating cases: minimum, normal, maximum and transition conditions, including changing demand where safe.
- Challenge faults: loss of sample flow, bubbles, analyzer fault, frozen signal, reference disagreement, communications loss and loss of process water flow.
- Accept the outcome separately: equipment loop, residual boundary and treatment performance each receive their own pass/fail evidence.
Acceptance criteria should name the method version, location, range, tolerance, comparison method, stabilization time, number of points, repeat rule, data owner and decision authority. “Analyzer works” or “ozone detected” is not a measurable acceptance statement.
Copyable dissolved-ozone measurement data block
Use this information before requesting an analyzer or complete ozone-system proposal. Unknown fields may remain TBD if each has an owner and closure plan.
Facility and jurisdiction: [country/region, industry, applicable water, safety, electrical and validation requirements]
Measurement purpose: [process trend, feedback control, alarm/trip, post-destruction protection, validation or contractual acceptance]
Measurand: [dissolved molecular ozone, TRO, ORP or named treatment outcome]
Water matrix: [source, conductivity, salinity/bromide, temperature, pH, turbidity/TSS, colour/UV, organics and other oxidants/reductants]
Process locations: [injection, contactor outlet, post-destruction, final return/discharge and reference tap]
Operating envelope: [water flow/pressure/temperature, applied ozone, expected low-normal-high residual and demand variation]
Measurement mode: [grab, portable, continuous in-line or continuous sample loop; required response and availability]
Method: [indigo, membrane electrochemical, UV, DPD/iodometric, ORP or other controlled method; unit and reporting basis]
Sample system: [take-off, materials, length, diameter, flow/pressure control, flow cell, bubble handling, lag, drain/return and access]
Interferences: [known oxidants, reductants, colour, particles, optical absorbers, fouling and mitigation]
Verification: [reference method, location, synchronized timing, frequency, tolerance, owner and disagreement action]
Control action: [modulation, alarm, shutdown, diversion, permissive and bad-signal state]
Acceptance: [FAT, SAT, operating cases, repetitions, tolerance, records and decision authority]
Scope split: [GUOLIN / analyzer supplier / EPC / owner / laboratory / process specialist / authority]
Use the industrial ozone-system RFQ guide to place these fields beside the treatment duty, generator, feed gas, cooling, contact, destruction and control scope. The utility checklist helps close power, cooling, ventilation, drainage, instrument and communication interfaces.
The practical buying rule
Do not compare ozone analyzers until bidders receive the same measurand, water matrix, sample location, operating range, response requirement, interference list, reference method, control action and acceptance rule. Ask every bidder what the instrument measures, what it does not measure, how the sample reaches it, how it fails, how it is checked and what the process does when the signal is unavailable.
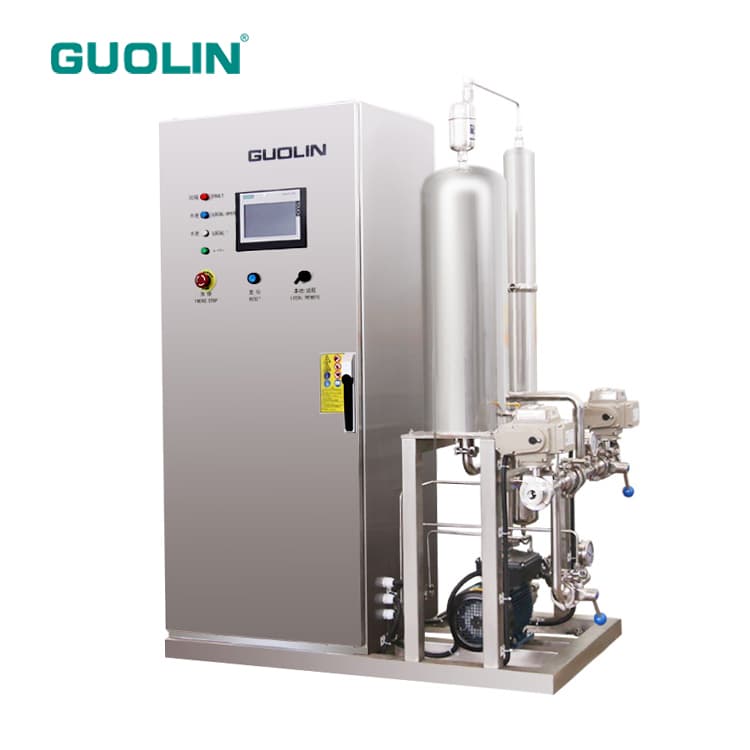
GUOLIN is China’s only publicly listed ozone-system manufacturer, with complete-system design, manufacturing and integration capabilities. GUOLIN can coordinate the ozone-generation, dosing/contact, residual-management, sample-point, instrument and control interfaces within the agreed project scope. Send the completed data block through the technical project-review form. Final analyzer selection, analytical method, limits and compliance basis remain subject to the actual water, the instrument supplier, the responsible laboratory and accountable project review.
Frequently asked questions
What is the best method for measuring dissolved ozone in water?
There is no universal best method. Choose by measurand, water matrix, expected range, grab or continuous duty, required response time, interferences and verification plan. Indigo is often useful for immediate grab/reference analysis; membrane or UV instruments can support continuous monitoring when the sample system and matrix are suitable.
Is ORP the same as dissolved ozone concentration?
No. ORP is a non-specific redox signal influenced by all oxidants and reductants, pH, temperature, electrode condition, flow and sample location. It can support trends, alarms or interlocks after site validation, but there is no universal conversion from millivolts to mg/L dissolved ozone.
How quickly must a dissolved-ozone sample be tested?
Normally immediately under the selected controlled method because ozone decays and can escape during transport. Minimize delay, agitation, warming, bubbles, headspace and transfers. If the laboratory is remote, bring the reaction step to the sample point or use another validated arrangement.
Can a membrane ozone sensor control an ozone generator directly?
It can provide a feedback signal within a validated control philosophy, but it should not act alone. Confirm sample flow, instrument health, process water flow, generator/contact permissives, signal range and delay; provide high-residual and bad-signal actions; and verify the sensor with an independent immediate reference method.
Does the indigo method measure only ozone?
The indigo method is selective and widely used for aqueous ozone, but reagent quality, blanks, colour, turbidity and certain oxidants can affect results. Follow the controlled method, analyze immediately and document what the procedure reports in the actual water matrix.
Why can online and grab-sample ozone results disagree?
Possible causes include different sample locations or timestamps, sample-line lag, ozone decay, bubbles, unstable flow or pressure, membrane fouling, optical interference, reagent or blank problems, temperature and calculation bases. Investigate both methods before adjusting one to match the other.
Should seawater ozone systems measure dissolved ozone or TRO?
It depends on the decision. Molecular dissolved ozone may be appropriate at a contact point, while total residual oxidants can be more relevant to longer-lived oxidant exposure in bromide-containing water. State the method, unit, reporting basis, location and sample delay; do not treat ORP, ozone and TRO as interchangeable.
What data does GUOLIN need to specify ozone measurement interfaces?
Provide the country and requirements, treatment objective, measurand, water matrix, salinity or bromide, sample locations, expected range, process flow, pressure and temperature, grab or continuous duty, response time, existing instruments, reference method, interferences, control and alarm actions, utilities, acceptance cases and scope split.
Related articles
Application Guide
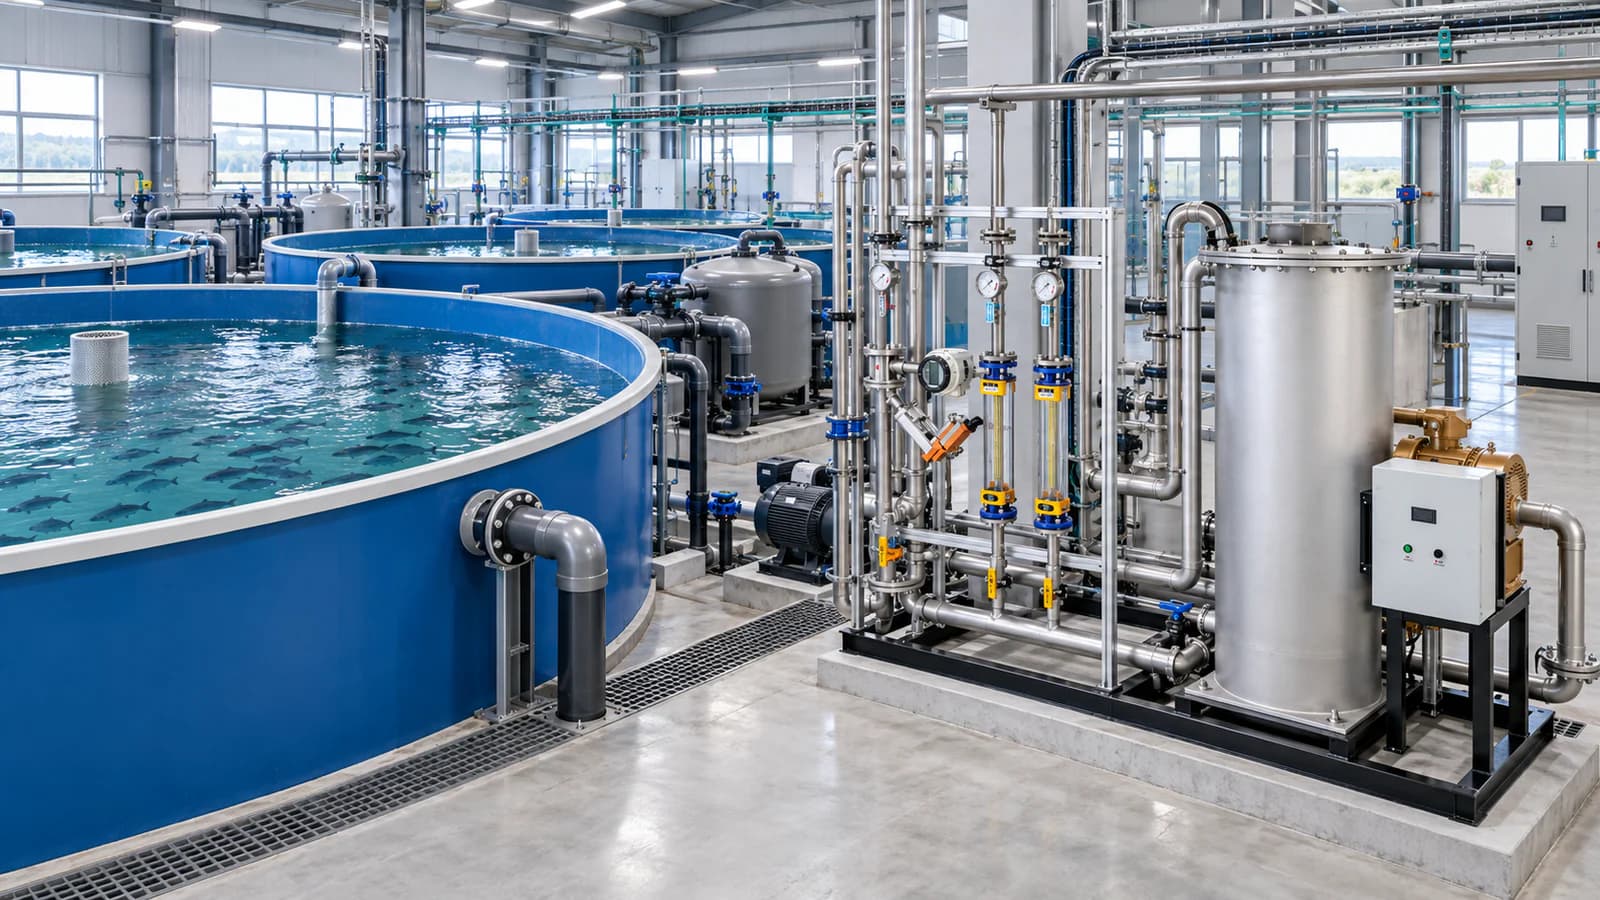
Ozone in Recirculating Aquaculture Systems: Side-Stream Design, ORP and Residual Control
Plan ozone in RAS: side-stream placement, ORP and residual monitoring, fish and biofilter protection, controls, commissioning and acceptance.
Application Guide
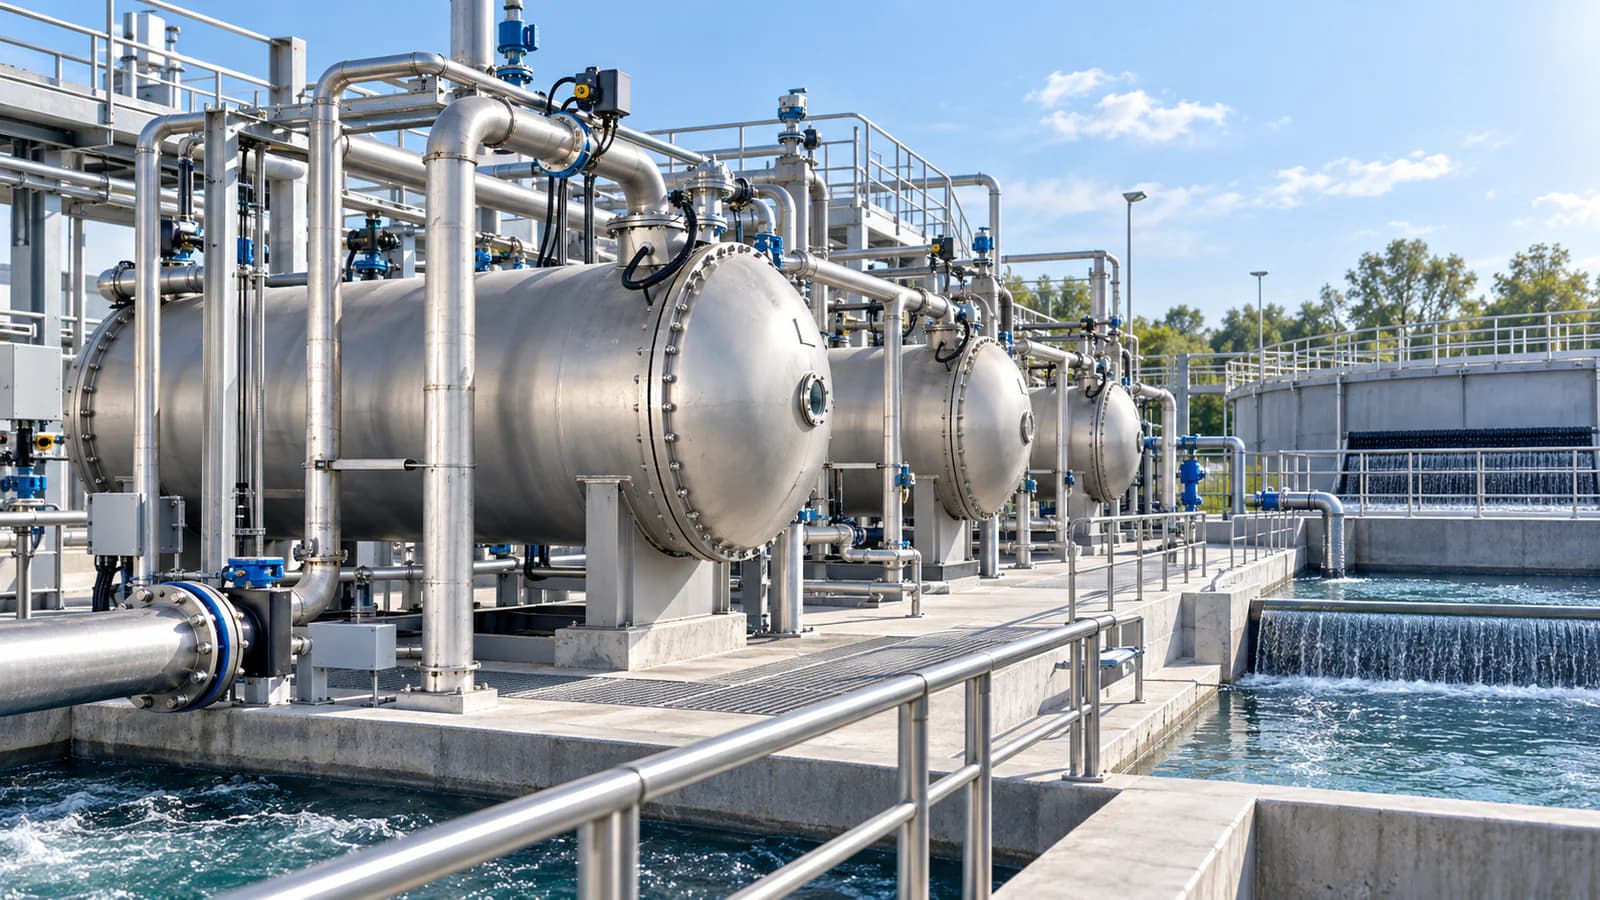
Ozonation for Micropollutant Removal in Municipal Wastewater: Design, Monitoring and Limits
Learn when municipal wastewater ozonation fits micropollutant removal, how to define dose and post-treatment, and what evidence is needed for control and acceptance.
Application Guide
Bromate Formation in Drinking-Water Ozonation: Risk Factors, Control and Monitoring
Understand how bromate forms during drinking-water ozonation, which source-water and process variables change risk, how control options trade off, and what to monitor before design and acceptance.
Application Guide
Ozone-BAC Drinking Water Treatment: Process, Monitoring and Limits
Learn how ozone and biologically activated carbon work together, how BAC differs from GAC, what changes performance, and what to monitor before specifying a drinking-water system.
Technology
Ozone vs Chlorine vs UV for Water Disinfection: How to Choose
Compare ozone, chlorine and UV by treatment role, residual, water quality, by-products, validation and complete-system scope—not by a universal winner table.
Technology
Ozone Mass Transfer, Contact Time and Off-Gas Treatment: An Engineering Guide
Learn how to specify ozone transfer efficiency, contact time, dissolved residual, contactor hydraulics and off-gas treatment as one measurable process boundary.
Technology
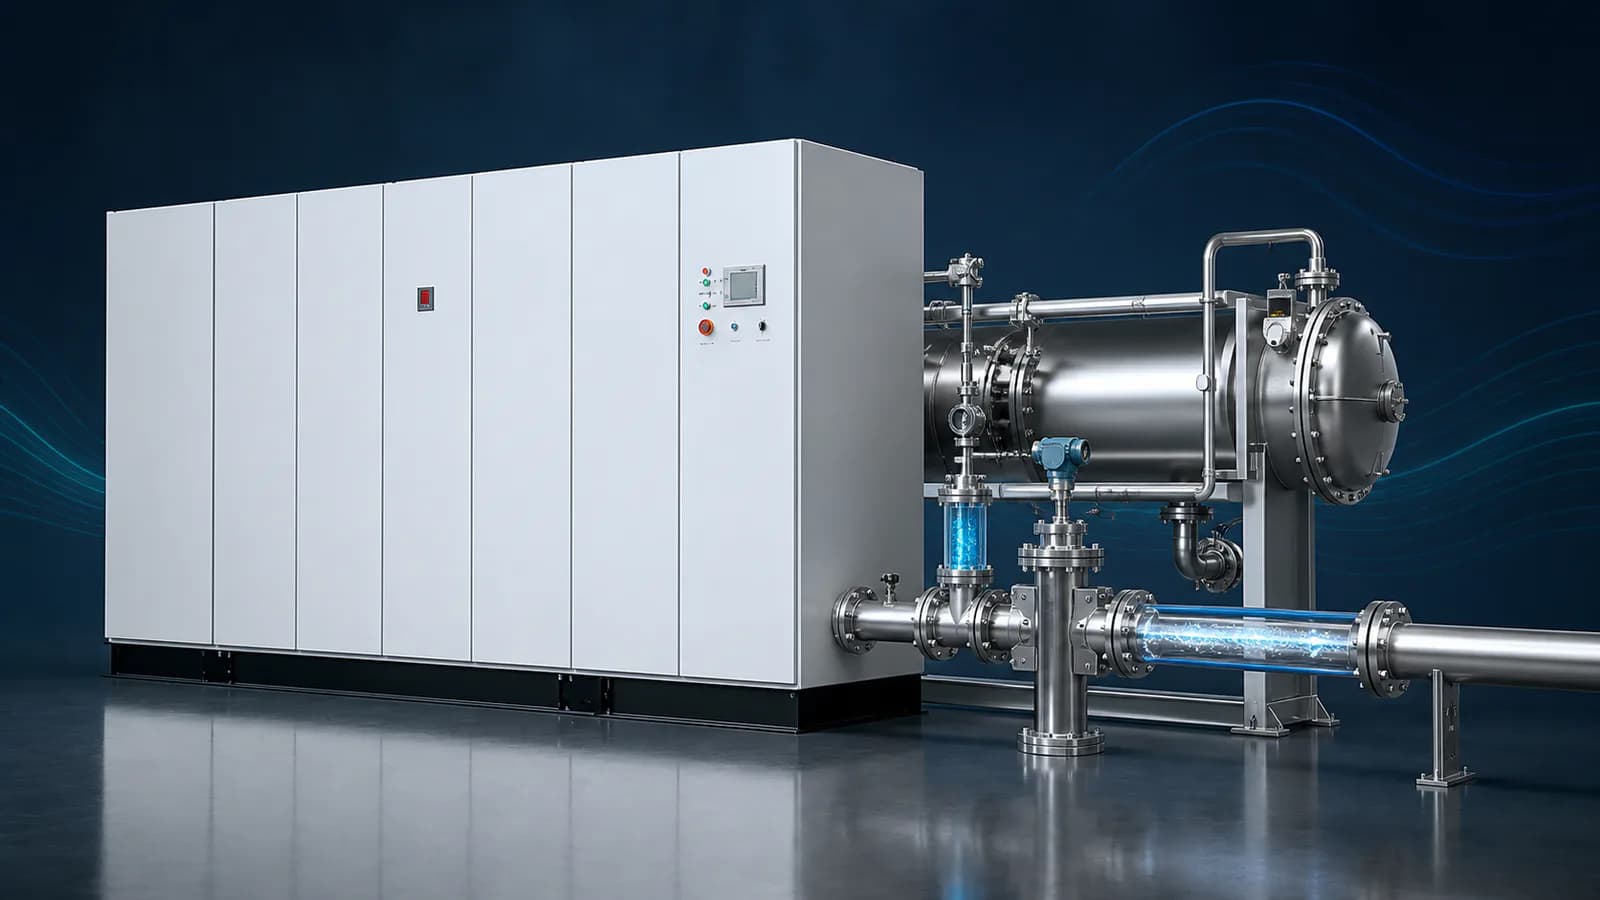
Ozone Concentration vs Ozone Output: g/Nm³, wt%, g/h and kg/h Explained
Learn how ozone concentration, product-gas flow and ozone output relate—and how to compare g/Nm³, wt%, g/h and kg/h without mixing measurement bases.
Buying Guide
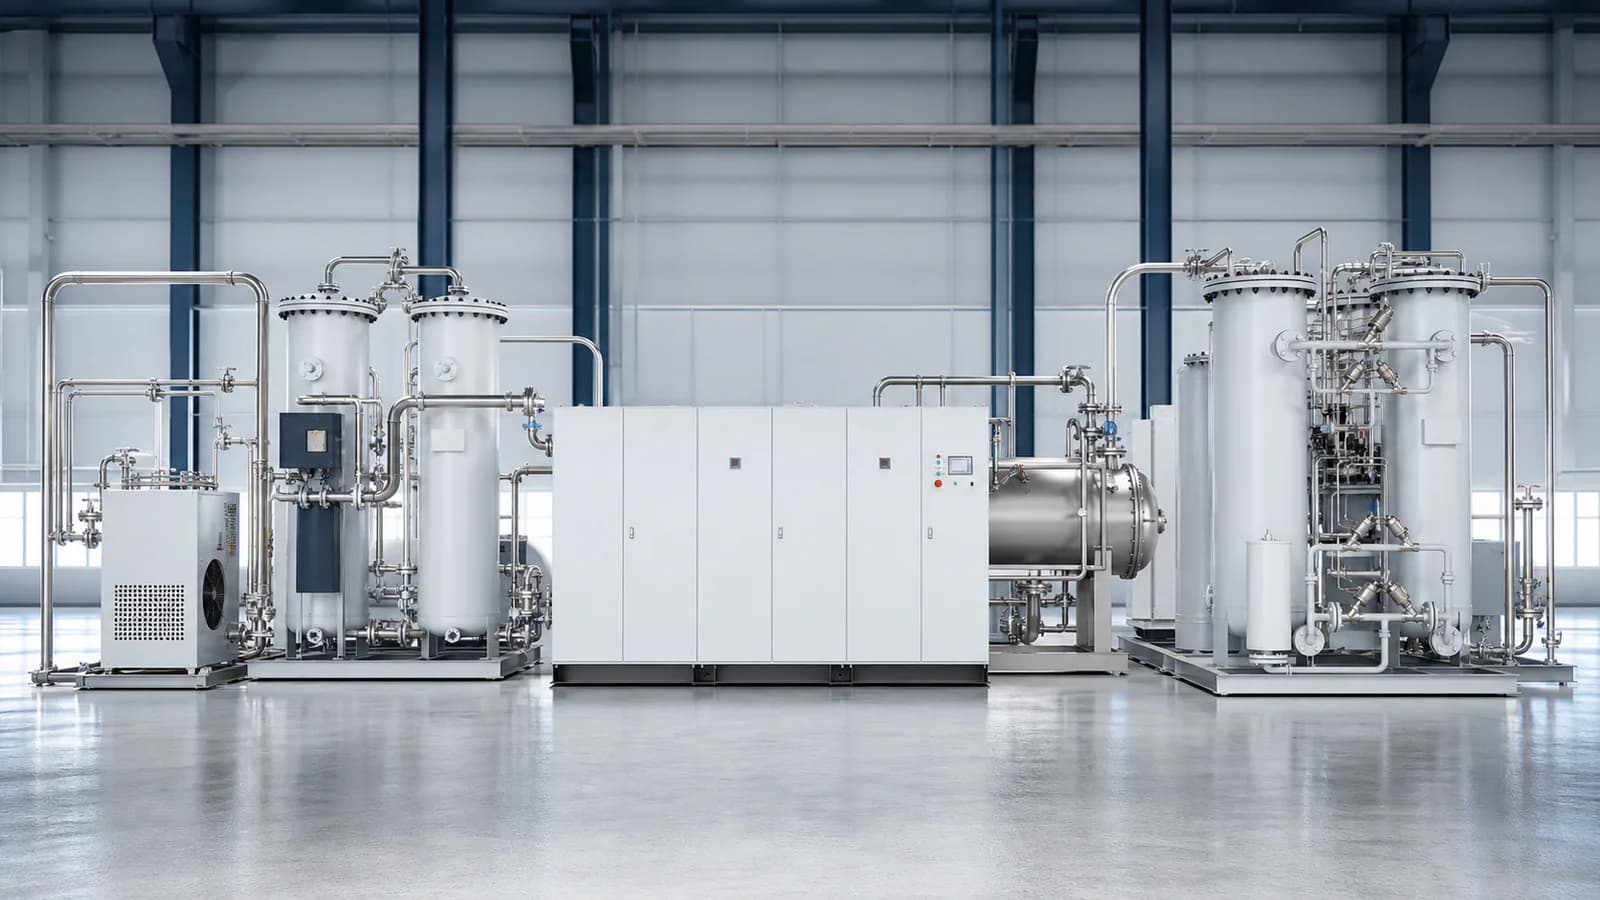
Air-Fed vs Oxygen-Fed Industrial Ozone Generators: How to Choose the Feed-Gas Route
Compare air-fed and oxygen-fed industrial ozone generators by concentration, product-gas flow, utilities, oxygen supply, operating profile and complete-system cost.

Buying Guide
How to Prepare an Industrial Ozone System RFQ: A Specification Checklist
Build a comparable industrial ozone system RFQ with a clear design basis, scope boundary, operating cases, bidder response schedule and acceptance requirements.
Buying Guide
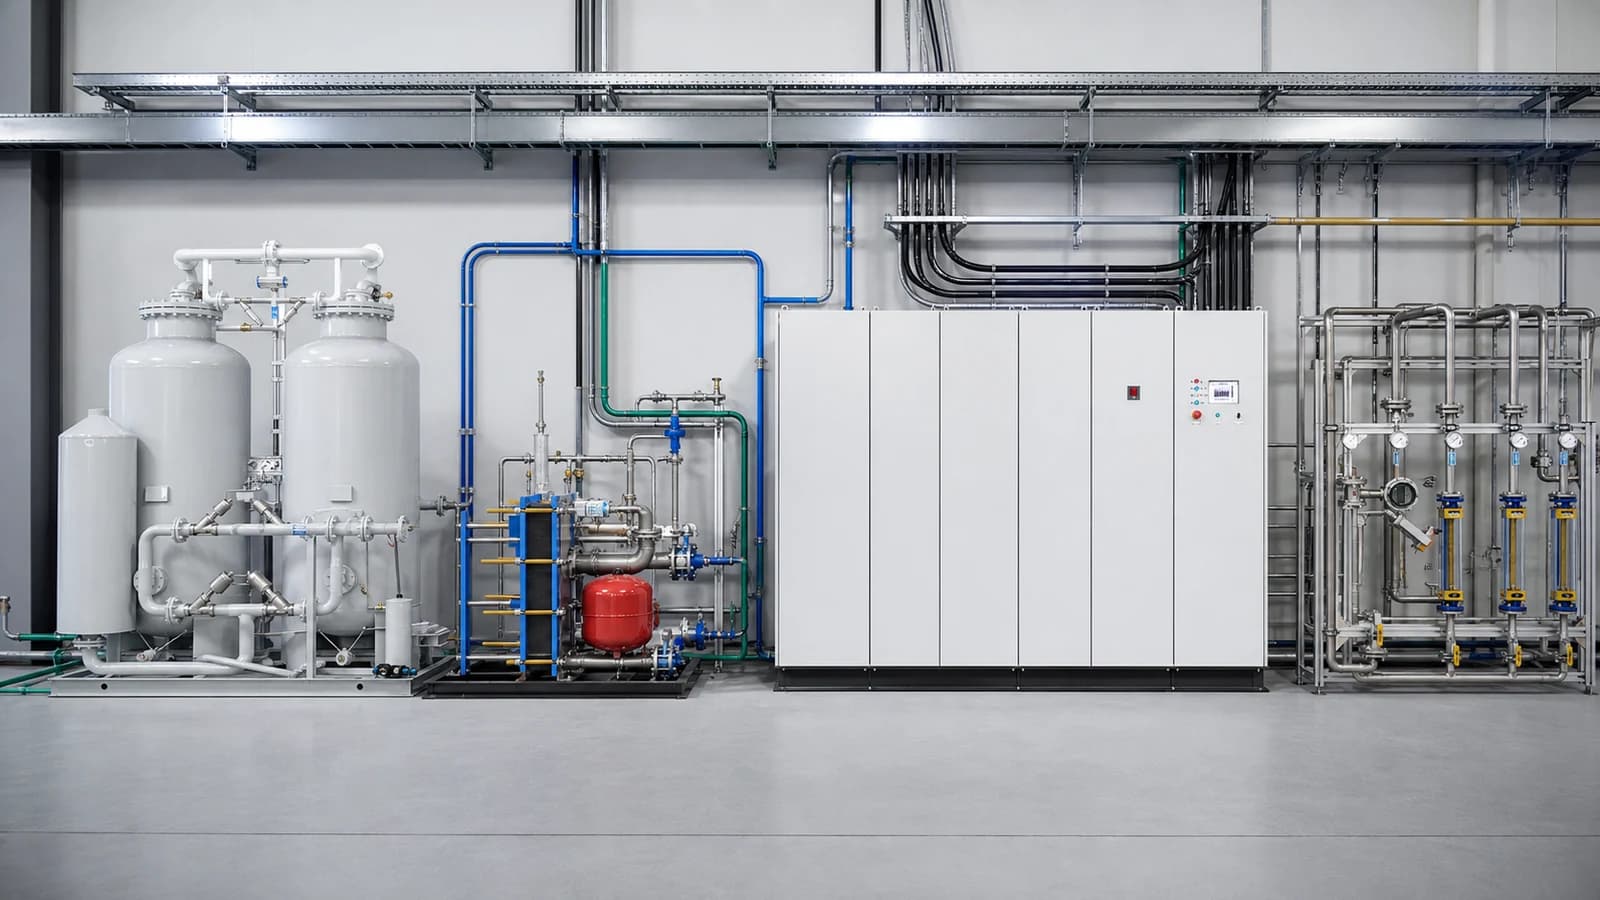
Industrial Ozone System Utility Requirements: A Site-Preparation Checklist
Prepare power, feed gas, cooling, ventilation, drainage, layout and control interfaces for an industrial ozone system using a responsibility-based site checklist.
Buying Guide
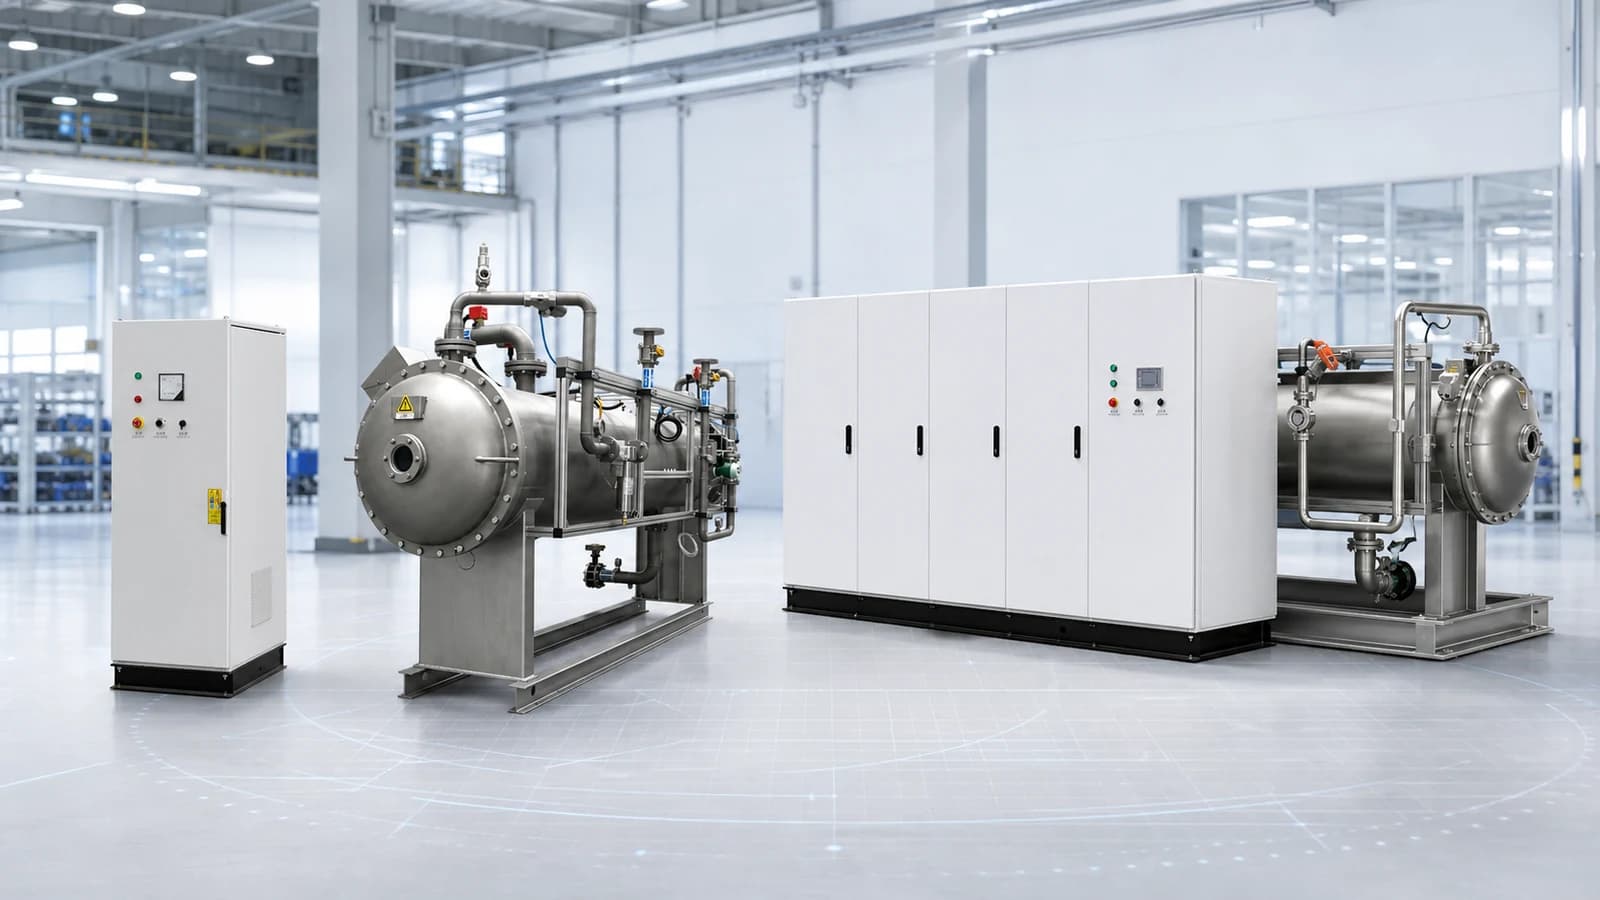
Industrial Ozone Generator Sizing for Water Treatment: Inputs, Calculations, and Limits
Learn how to calculate industrial ozone-generator capacity from water flow, defined ozone dose and transfer efficiency—without confusing generated, transferred or residual ozone.
Buying Guide
What Is Included in a Complete Industrial Ozone System?
See which equipment, controls, utilities and project interfaces may be included in a complete industrial ozone system—and what every proposal must define.